Edit chart
Loading graph
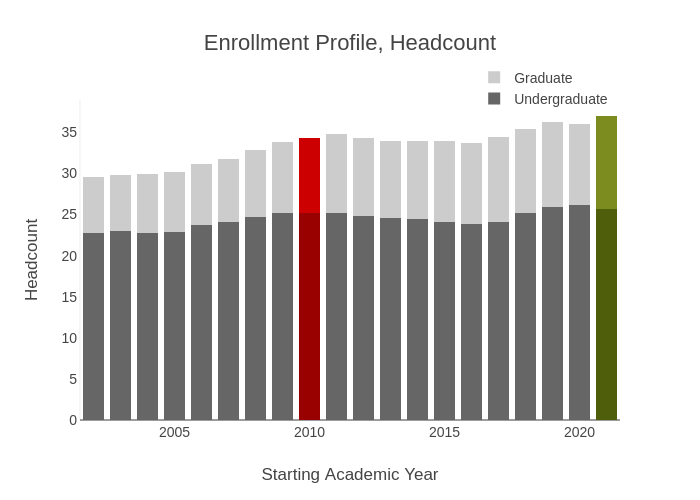
Provostncstate's interactive graph and data of "Enrollment Profile, Headcount" is a stacked bar chart, showing Undergraduate, Graduate, UG Baseline, Grad Baseline, UG Goal, Grad Goal; with Starting Academic Year in the x-axis and Headcount in the y-axis.. The x-axis shows values from 2001.5 to 2020.5. The y-axis shows values from 0 to 38947.36842105263.